Free
See where every market stands today.
$0forever
- Dashboard & market overview
- Advanced search
- Up to 10 watchlist symbols
- Not included: Basic email alerts
- Not included: Priority support
No card needed.
Updated daily for stocks, indices and crypto
We rank every stock, index and crypto against its own last five years. Green means it’s cheap. Red means it’s stretched. No jargon, no hype.
Free. No card, no sign-up to look around.
Move your cursor across the chartDrag across the chart
Sound familiar?
What you pay decides what you make. Yet it’s the one thing most tools bury under fifty indicators.
Everyone was talking about it, so you got in. It dropped 30%, you sold in a panic, and then it came back without you.
Prices fell, headlines screamed, you waited for things to calm down. By the time it felt safe, it was 40% higher.
RSI, MACD, ten videos, three opinions. Still no straight answer to the only question that matters: buy now, or wait?
13years
That’s how long the S&P 500 took to climb back to its March 2000 high.
Same index. Same “just buy and hold” advice. The difference was the price people paid.
S&P 500 price index, closing highs of 24 March 2000 and 28 March 2013, dividends excluded.
How it works
No charts to decode, no course to buy. One reference point, built from each asset’s own history.
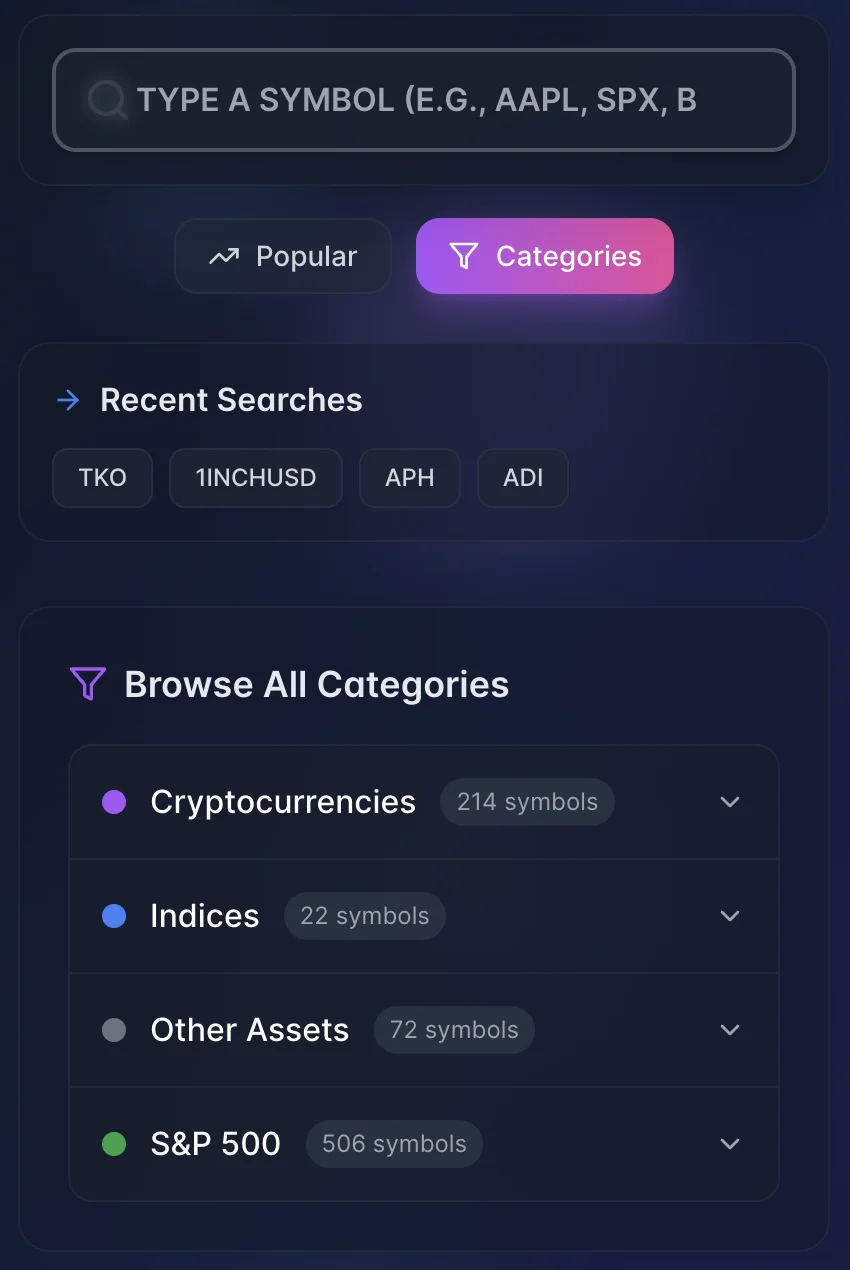
Every S&P 500 stock, the major indices, 200+ cryptos and more. Type a ticker and you’re there.
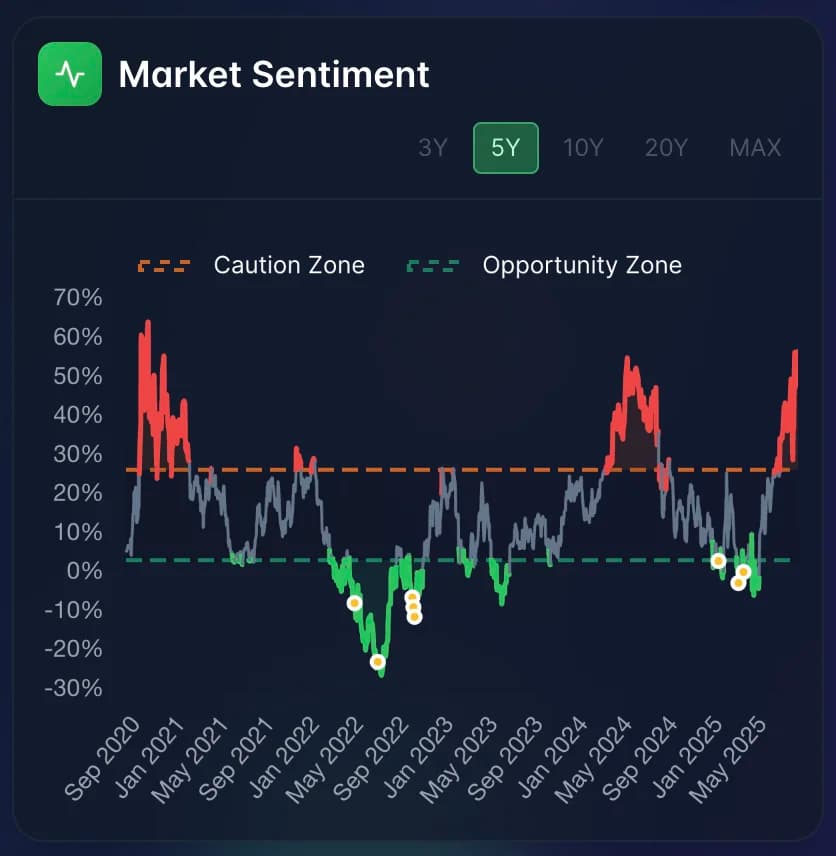
We rank the last six months against the asset’s own five-year history. Bottom 20%: green, an Opportunity Zone. Top 20%: red, a Caution Zone. Grey means no rush.
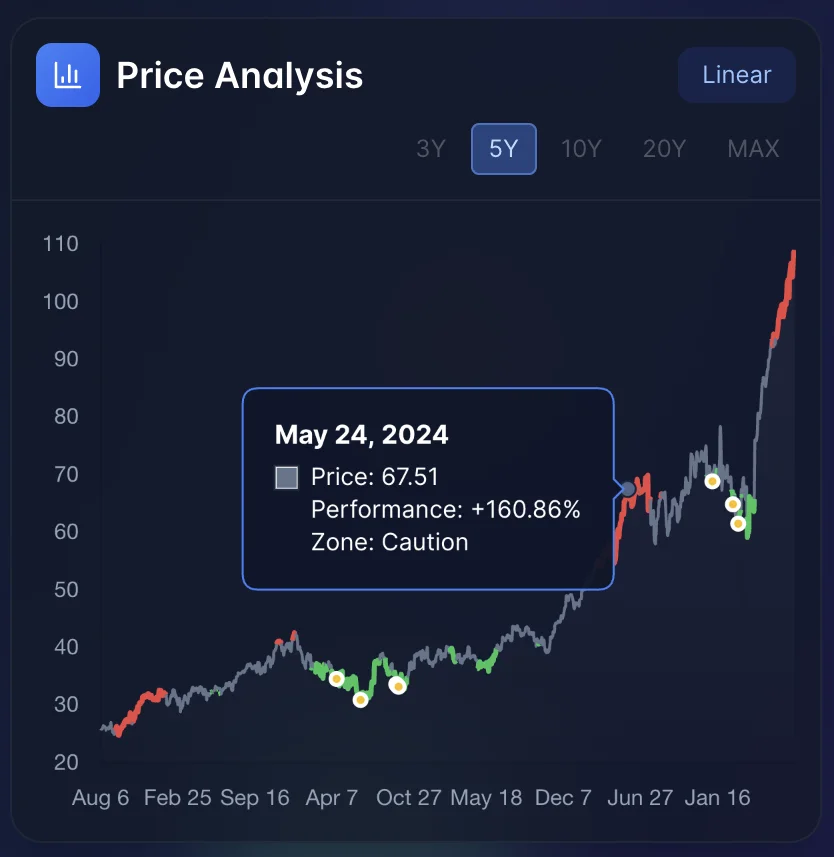
Yellow dots mark oversold moments, when several momentum signals agree at once. On Pro, watchlist a symbol and we email you when a new one fires.

Straight talk
BetterBuyLow exists to answer one question before you buy: is this price cheap or stretched compared with its own history? Everything else is detail.
Pricing
The dashboard is free, no card needed. Pro adds alerts and room for a real watchlist.
See where every market stands today.
$0forever
No card needed.
Get told when it’s time, instead of checking.
$17.42/ month
Billed $209 once a year
Cancel anytime from your profile.
No tool can do that honestly. It tells you when a price is unusually low or high for that asset, so you stop buying on hype and start buying with a plan.
Each asset is compared with itself, not with the market. We rank its last six months against its own five-year history: the bottom 20% is the Opportunity Zone, the top 20% the Caution Zone.
No. If you can read a traffic light, you can use it. The detail is there when you want it.
Every S&P 500 stock, the major indices, 200+ cryptocurrencies and a set of other assets. Data updates daily.
Yes, from your profile. And if Pro isn’t for you, ask for a refund within 7 days.
No. BetterBuyLow is an educational analytics tool. It shows you where a price stands; what you do with that is your call.
The only question is whether you’ll recognise it this time.